February 27, 2026
Why Peak Crush Compression Is Invisible Until It’s Too Late
Why Peak Crush Compression Is Invisible Until It’s Too Late
Why Peak Crush Compression Is Invisible Until It’s Too Late
Most mills celebrate peak crush numbers at the start of the season.
If the first 30 days look strong, confidence follows.
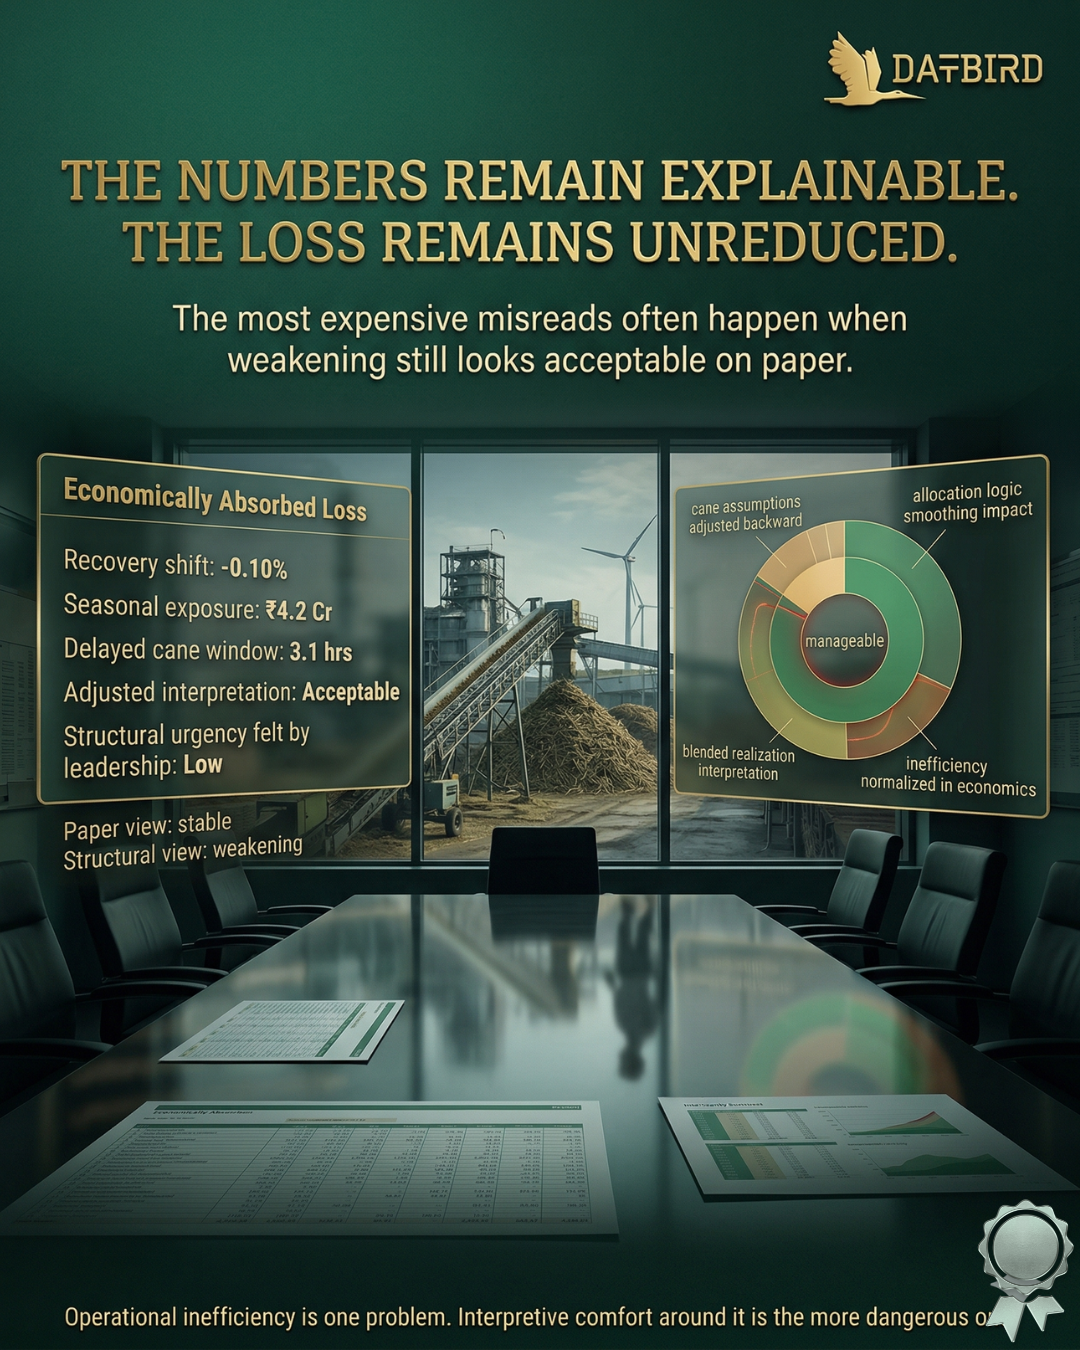
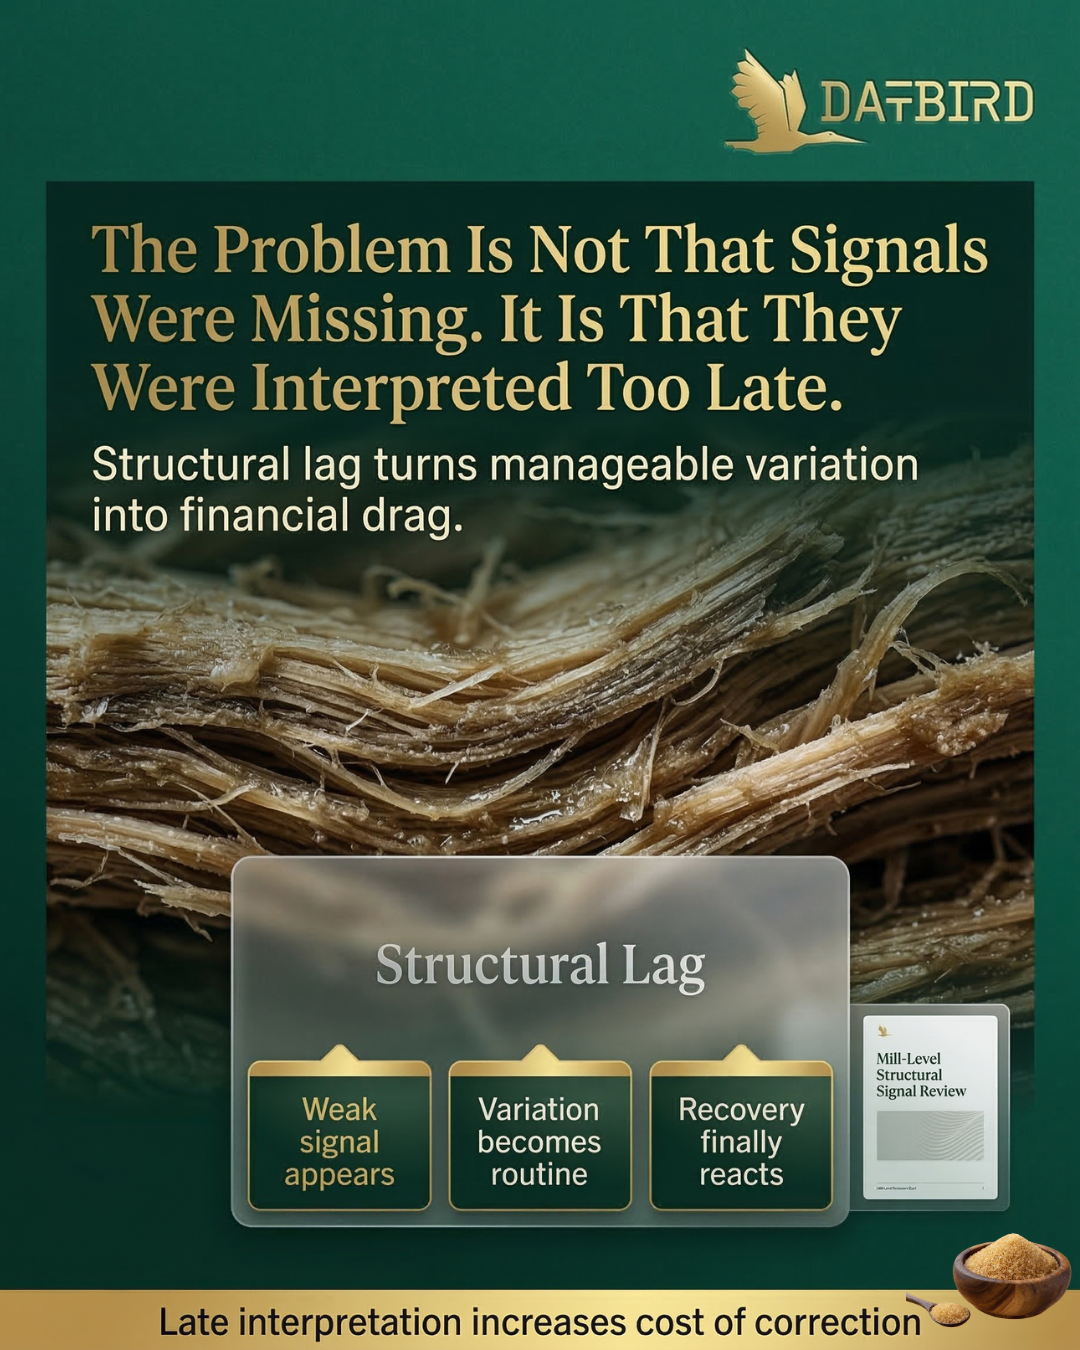
But by the time peak compression becomes visible in reporting, the structural drift has already occurred.
Peak crush is not an operational event.
It is a structural outcome.It is shaped months earlier by:
• Ratoon-to-plant cane balance
• Variety concentration discipline
• Harvest synchronization
• Maturity alignment
• Procurement incentives
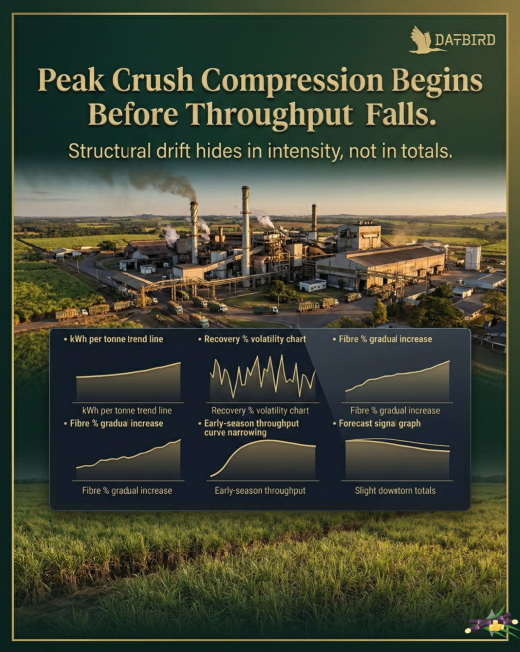
When ratoon creep increases beyond structural threshold, fibre rises and sucrose response weakens.
When variety dilution spreads across too many mid-performing cultivars, recovery volatility rises.
When early-season cane maturity is misjudged, the mill underperforms precisely when fixed costs are most sensitive.
The result is not an immediate collapse.
It is gradual compression of peak throughput.
And peak throughput determines seasonal economics.
Consider a mill designed for 10,000 TCD peak capacity.
If structural drift reduces effective peak utilization by just 15–25%, the impact is material.
At 10,000 TCD planned, but only 8,000–8,500 TCD achieved during peak window:
Over a 40-day peak cycle, that’s a shortfall of 60,000–80,000 tonnes of cane.
At 10% recovery, that equals:6,000–8,000 tonnes of sugar not crystallized during optimal window.
At ₹34,000 per tonne:₹20–27 crore revenue displacement potential — before considering downstream ethanol and power integration effects.
No single day looks alarming.
But seasonal EBITDA is reshaped.
Most boards review:
• Total season crush
• Average recovery
• End-of-season output
Few monitor:
• Peak crush sustainability index
• Ratoon creep ratio vs optimal threshold
• Variety concentration drift year-over-year
• Early forecast signals from field maturity patterns
By the time throughput compression appears in MIS reports, procurement strategy cannot reverse it.
This is not a plant efficiency issue.It is a structural alignment issue.
Peak crush compression is a leading indicator — not a lagging statistic.
If you want to see whether your mill is drifting structurally, we can run a 2-week risk scan.
Because in seasonal industries, margin compression begins long before the dashboard shows it.
Our latest news and trending topics