March 25, 2026
Two mills report the same recovery %. One quietly loses ₹10 crore.
Two mills report the same recovery %. One quietly loses ₹10 crore.
Two mills report the same recovery %.One quietly loses ₹10 crore.
The KPI looks identical.The economics underneath are not.Across the industry, recovery % is treated as the ultimate performance indicator.
When two mills show the same recovery number, the assumption is simple:both plants are performing equally well.
But recovery tells us how much sugar was extracted — not how efficiently the system produced it.
Recovery is a surface outcome.Profitability is shaped by the structural efficiency of the entire cane-to-crystal system.
Two mills can achieve the same recovery while operating under very different structural conditions:
• energy intensity per tonne crushed
• steam balance across evaporation stages
• fibre variability entering the milling tandem
• downtime recovery patterns during peak crush
• process stability under fluctuating cane quality
One system produces recovery with structural stability.
The other produces the same recovery while quietly expending far more internal effort.
From the outside, the KPI looks identical.Inside the system, the economics are diverging.
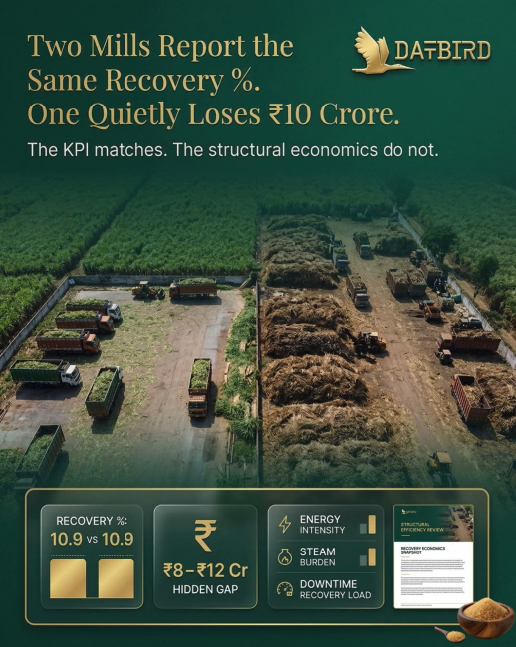
Consider two mills crushing 12–14 lakh tonnes per season.Both report 10.9% recovery.
But if one plant operates with:
• 3–4 kWh higher energy intensity per tonne
• slightly higher steam consumption
• more recycle load across boiling stations
• marginally higher downtime recovery cyclesthe seasonal difference can easily reach ₹8–₹12 crore in value variance.
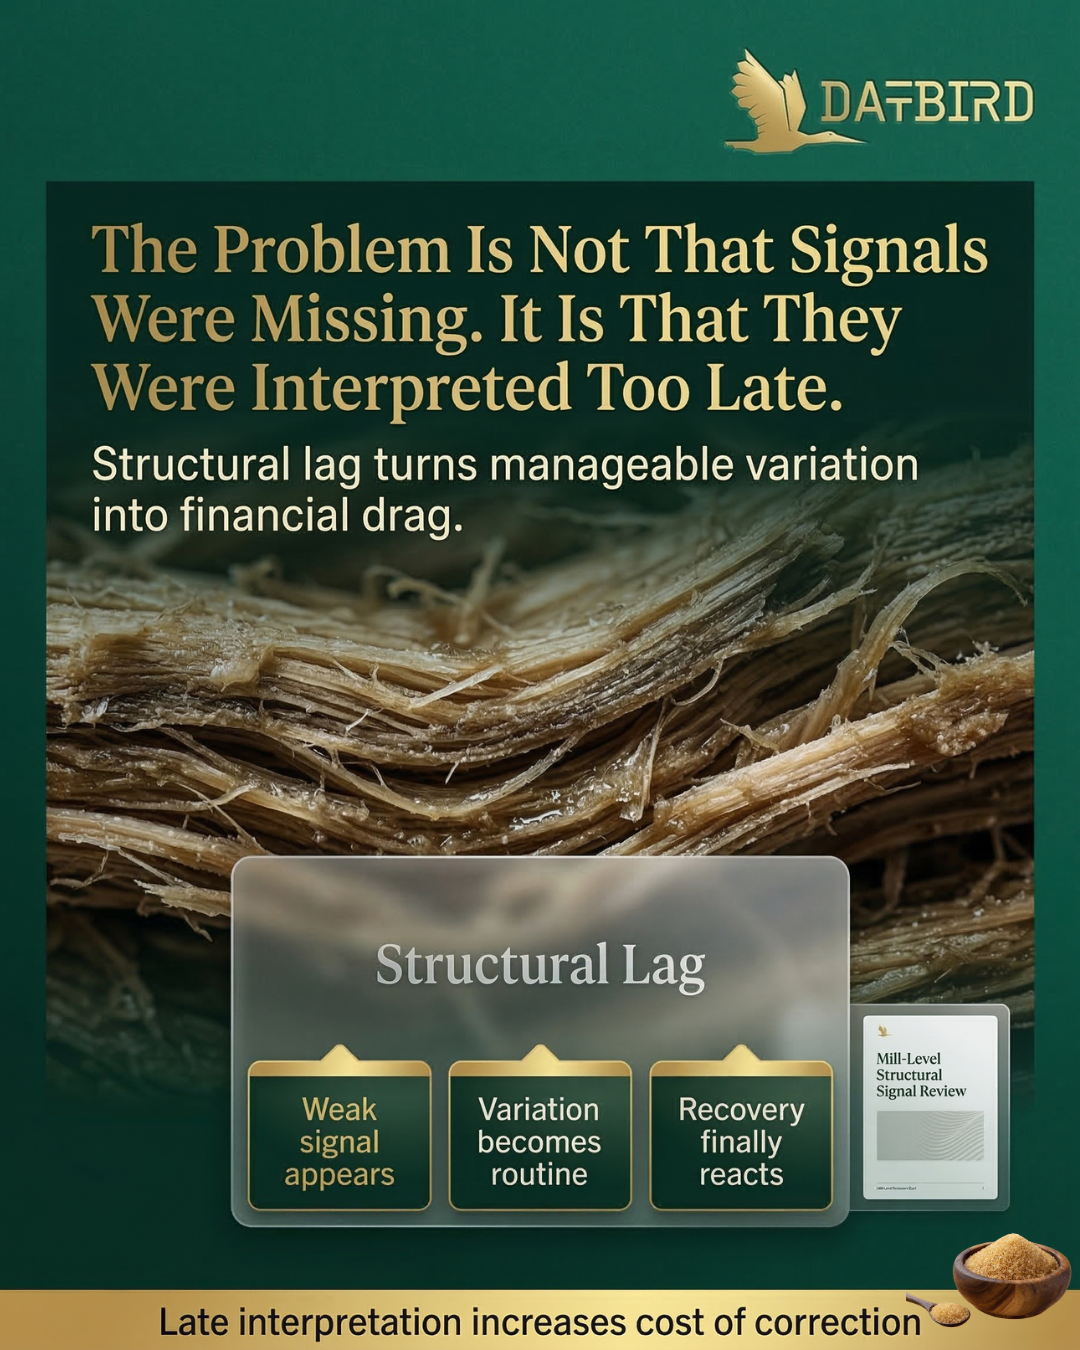
Yet the headline KPI suggests performance parity.This is where many leadership discussions stall.
The focus becomes:“How do we improve recovery?”But the deeper question is rarely asked:“How efficiently did the system produce that recovery?”
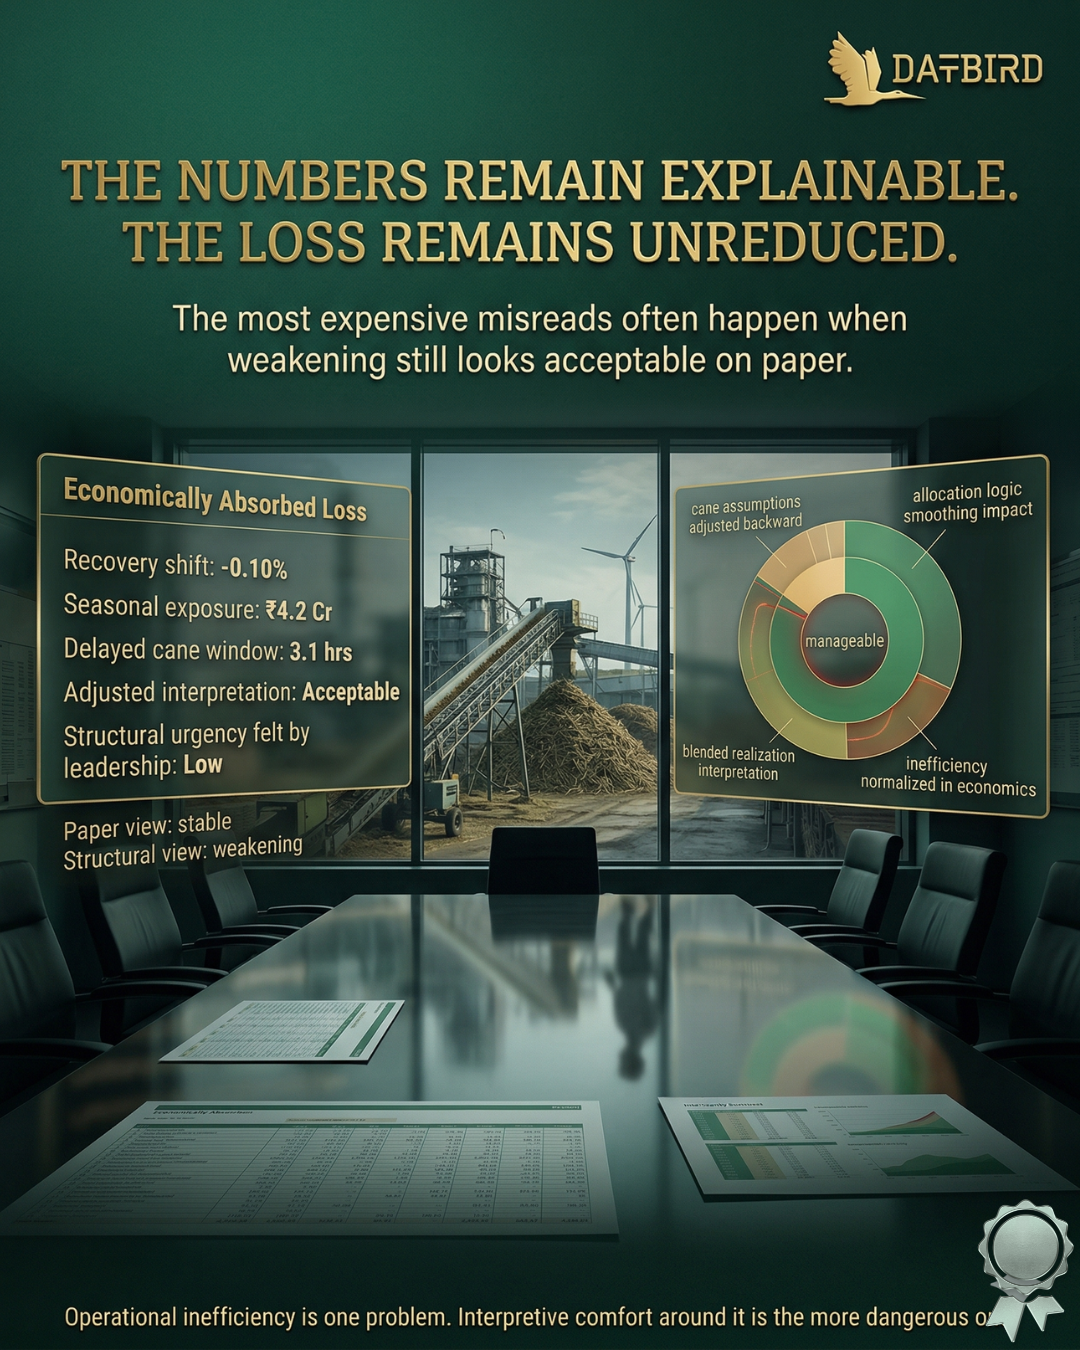
Before execution improvements can be made, leadership teams need structural clarity — visibility into the drivers shaping recovery stability and system efficiency across the season.
Without that diagnostic lens, plants often optimize symptoms rather than the system dynamics behind them.
Two mills can report the same recovery %and still operate with very different structural economics.
The difference rarely appears in the KPI.It appears in the system behind it.If you want this clarity before the next crushing season decisions are made, lets talk !
Our latest news and trending topics