February 21, 2026
Most sugar mills celebrate stable Recovery %.
Most sugar mills celebrate stable Recovery %.
Most sugar mills celebrate stable Recovery %.
Boards review it.Plants optimize it.Analysts benchmark it.
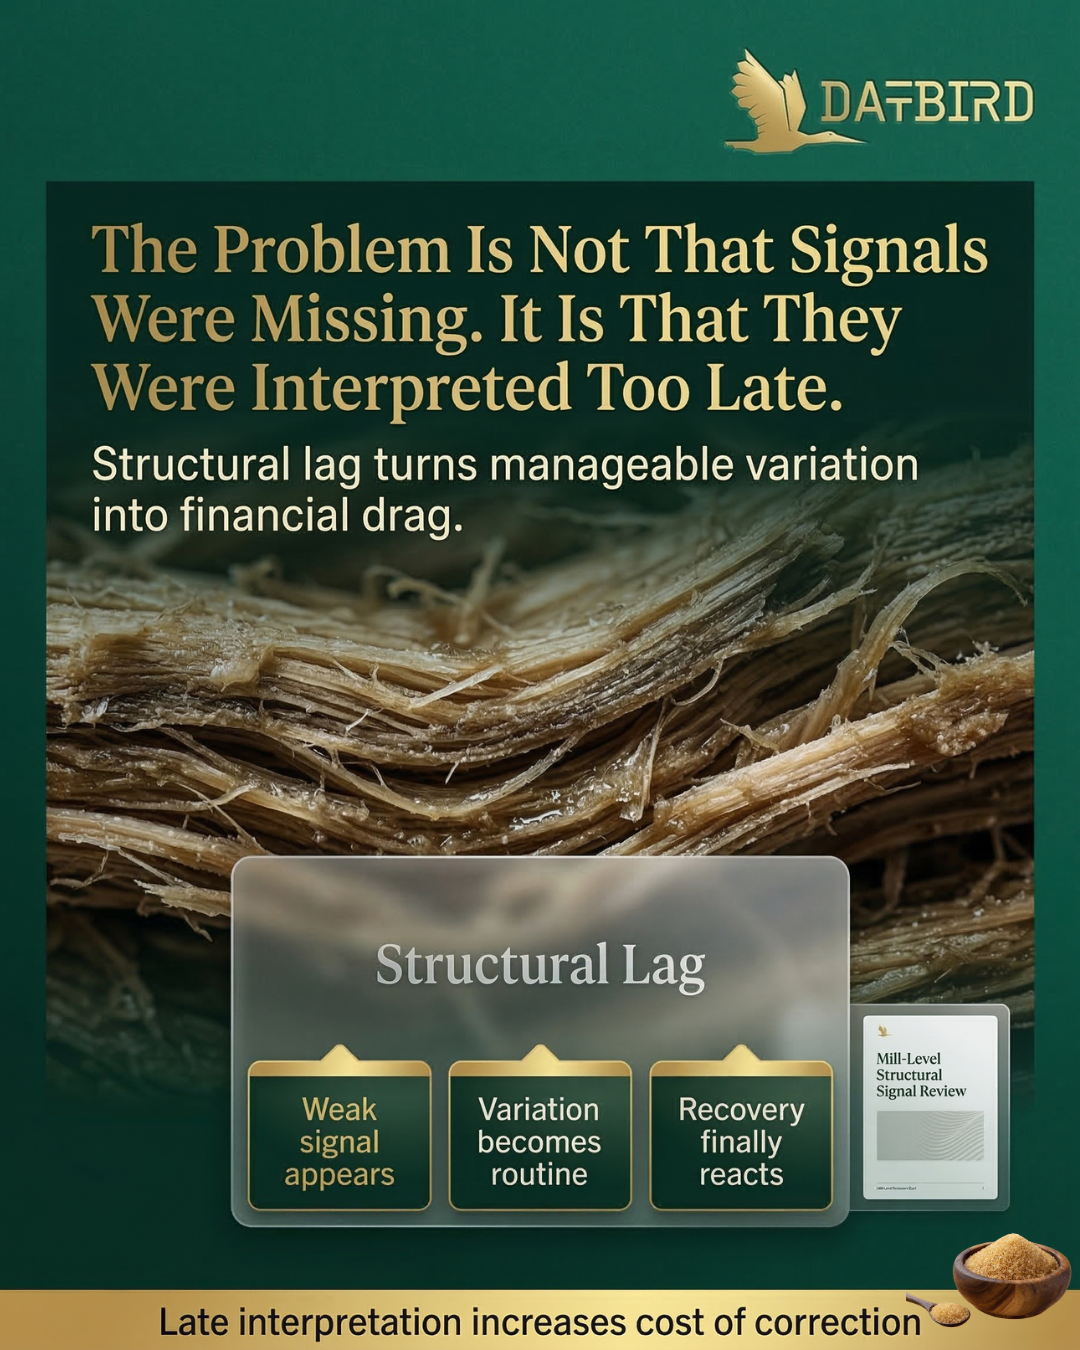
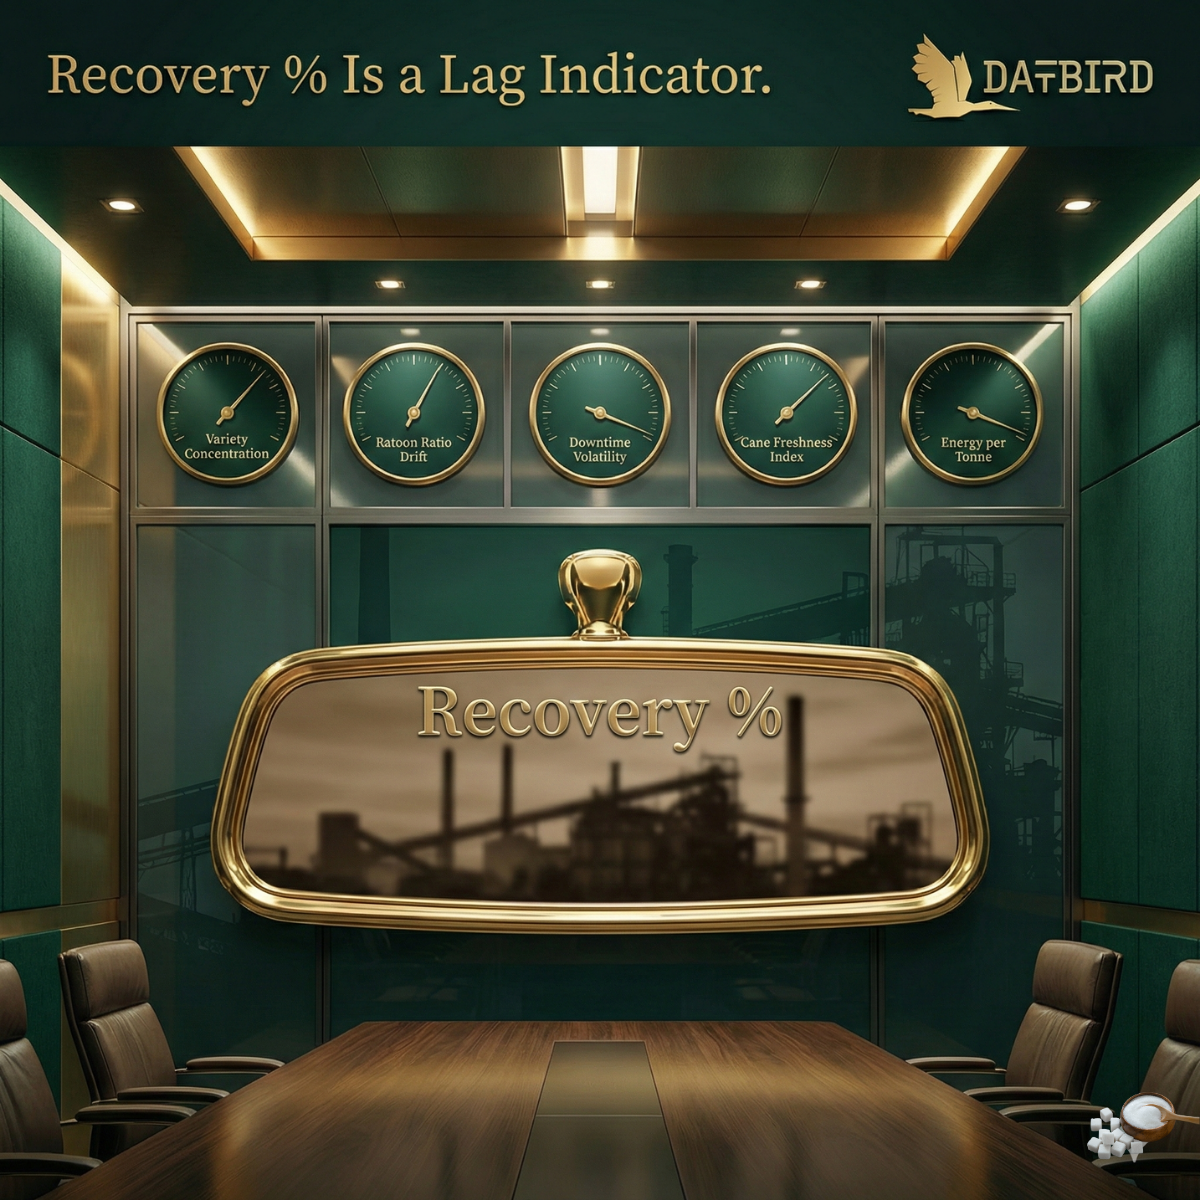
But Recovery % is a lag indicator.
By the time it moves,the structural cause is already embedded in the season.
Recovery % does not create performance.
It reports performance.
It reflects:• Variety decisions taken 12–18 months earlier
• Ratoon-to-plant mix imbalance• Harvest timing discipline
• Cane freshness variance at gate entry
• Downtime clustering during peak crush
• Energy instability during high-fiber runs
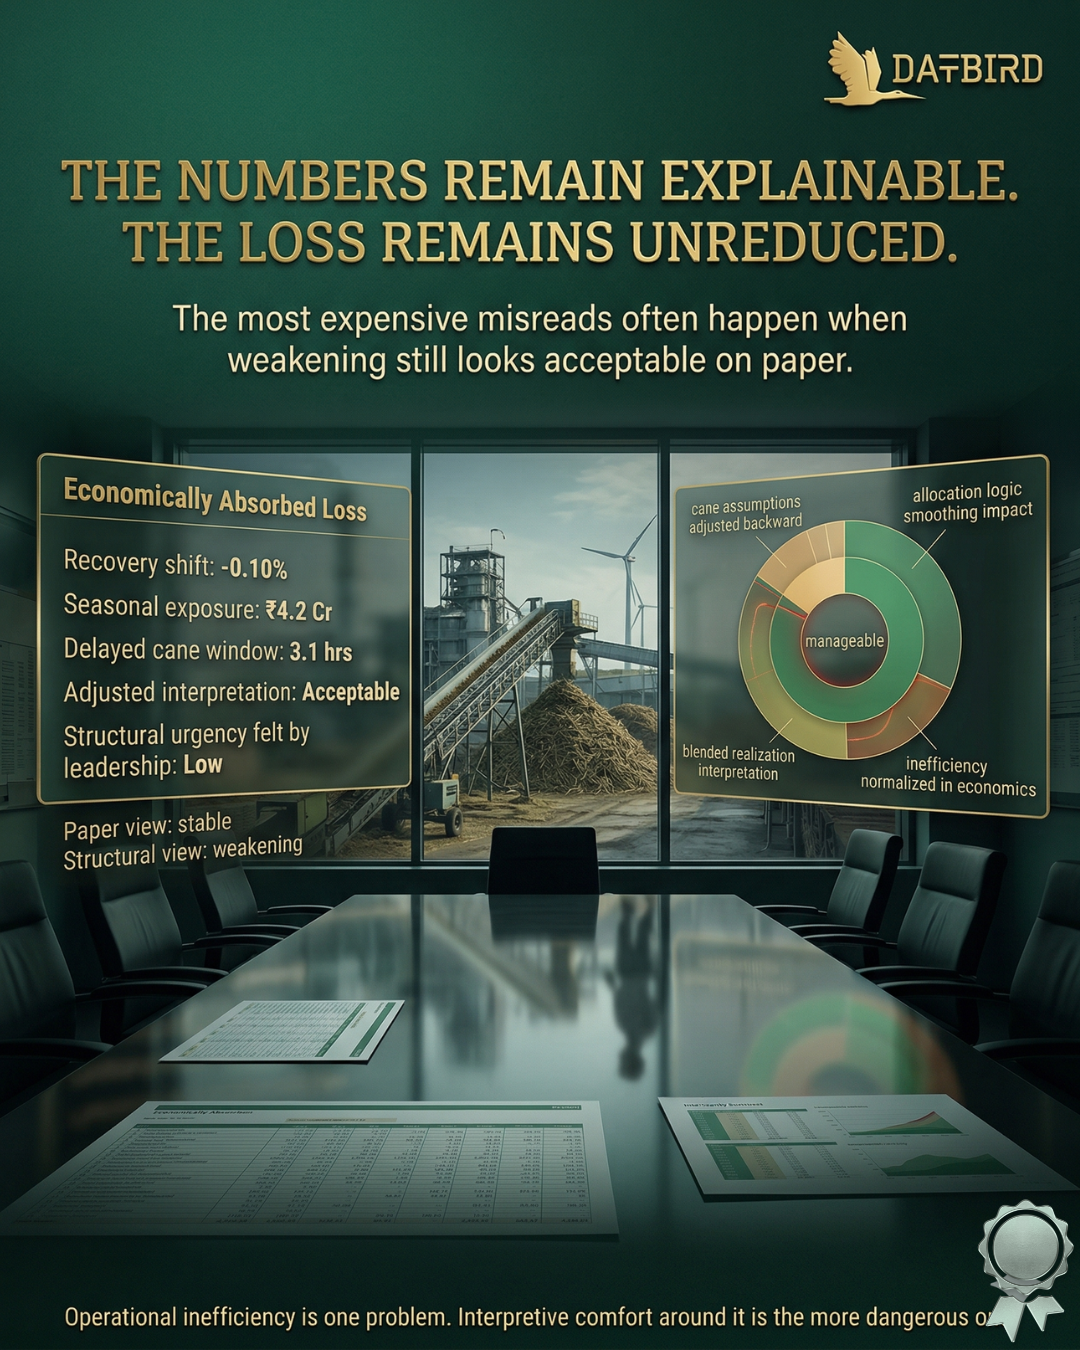
When Recovery drops 0.2%,the structural drift happened months before.
What looks like “operational fluctuation”is often measurement architecture failure.
Boards should not anchor only on Recovery %.
They should track leading structural indicators:
• Variety concentration ratio
• Ratoon concentration drift threshold
• 7-day downtime volatility band
• Cane age variance index
• Power per tonne deviation trend
• Early-season crush discipline index
Recovery % is the scoreboard.
Structural indicators are the steering wheel.
If Recovery % is your primary anchor metric,you are measuring outcome — not control.
Clarity before action.
Our latest news and trending topics